Random Numbers & Graphics
, Seville
If you are not interested in looking at random numbers or graphics I get it.
This will be a bit nerdy and I just do it because it’s fun for me but here is a first look at the data I collected from August 25 until October 19.
Summary
As an example, these are the latest 5 data points:
##   date       city    country max_temp weather           steps money_spent photos
##   <date>     <fct>   <fct>      <dbl> <fct>             <dbl>       <dbl>  <dbl>
## 1 2022-10-19 Seville Spain         26 Scattered Showers  7040       38.4       1
## 2 2022-10-18 Seville Spain         30 Sunny              8971        6.41      0
## 3 2022-10-17 Seville Spain         32 Sunny              8115       10.2       0
## 4 2022-10-16 Seville Spain         31 Scattered Showers  1787        1.5       1
## 5 2022-10-15 Seville Spain         30 Sunny              6076        8.28      0
I have been to these places:
## Seville               Cádiz                 Santiponce
## Lagoa                 Barbate               Schönefeld
## Berlin                Rüdersdorf bei Berlin
And this is a summary about each variable:
##       date                               city        country      max_temp
##  Min.   :2022-08-25   Seville              :42   Germany : 8   Min.   :21.00
##  1st Qu.:2022-09-07   Berlin               : 6   Portugal: 1   1st Qu.:27.00
##  Median :2022-09-21   Cádiz                : 3   Spain   :47   Median :30.00
##  Mean   :2022-09-21   Barbate              : 1                 Mean   :29.16
##  3rd Qu.:2022-10-05   Lagoa                : 1                 3rd Qu.:32.00
##  Max.   :2022-10-19   Rüdersdorf bei Berlin: 1                 Max.   :36.00
##                       (Other)              : 2
##                 weather       steps        money_spent          photos
##  Clear Night        :26   Min.   : 1787   Min.   :  ?????   Min.   : 0.0
##  Sunny              : 9   1st Qu.: 6850   1st Qu.:  ?????   1st Qu.: 1.0
##  Mostly Clear Night : 4   Median :10138   Median :  ?????   Median : 4.0
##  Partly Cloudy Night: 4   Mean   :12416   Mean   :  ?????   Mean   :12.8
##  Scattered Showers  : 4   3rd Qu.:18433   3rd Qu.:  ?????   3rd Qu.:18.0
##  Mostly Sunny       : 3   Max.   :35051   Max.   :  ?????   Max.   :82.0
##  (Other)            : 6
Just the max. amount of money spent in a day sticks a bit out because I withdrew some cash and my bank account lists it as an expense. For now I’m excluding online payments and I’m not even sure why but next time I’d probably include them.
Also, I’m not sure why there is a lot of “Clear Night” weather listed. I will look into the source again.
Cool Graphics
Daily Steps
The distribution of daily steps is skewed with a median of 10,138. Considering that I didn’t do any running I think that’s pretty good.
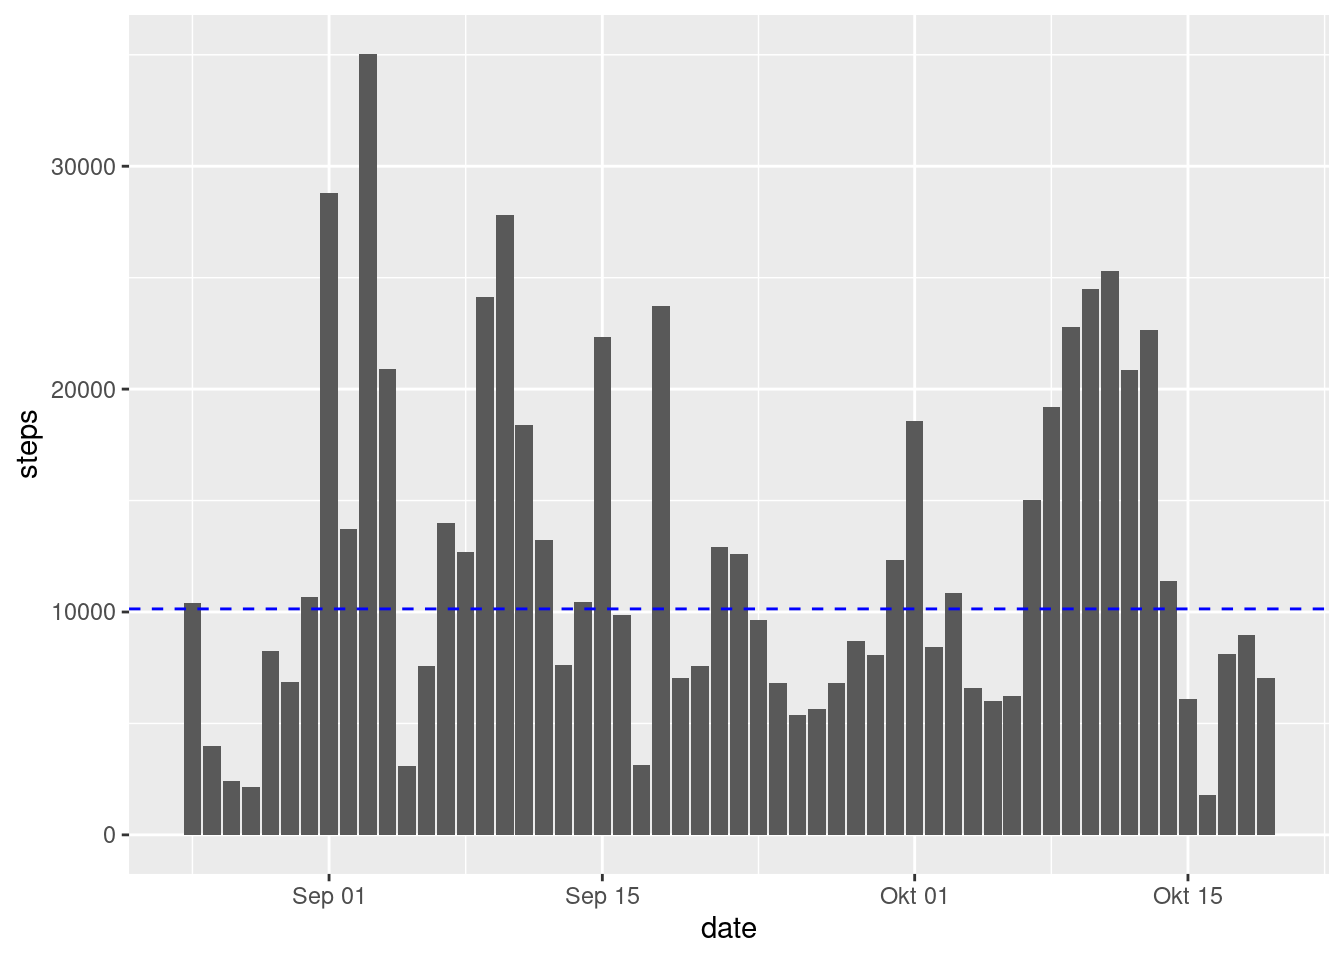
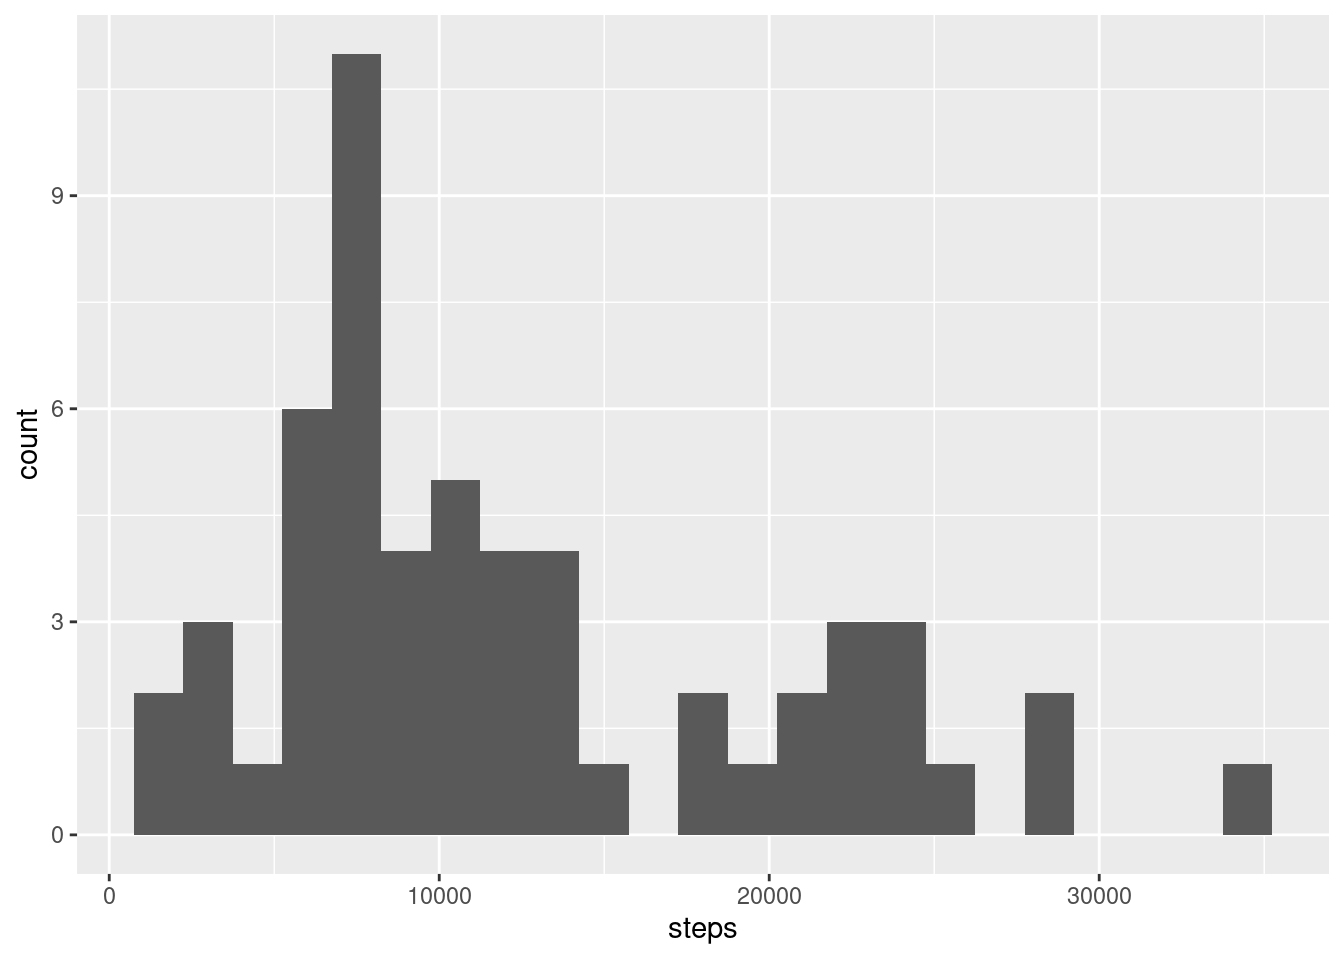
I'm not sure how accurate the step data is as it comes from my phone and I can't verify it but for me it sounds plausible.
Daily Money Spent (Offline) in €
I'm not sure yet how much numbers I want to show about money so for now I'm not showing much.
Excluding the day I withdrew some cash, the day I spent the most money is this one:
##   date       city  country max_temp weather            steps money_spent photos
##   <date>     <fct> <fct>      <dbl> <fct>              <dbl>       <dbl>  <dbl>
## 1 2022-09-18 Cádiz Spain         32 Mostly Clear Night 23742           ?     82
Daily Max. Temperature in °C
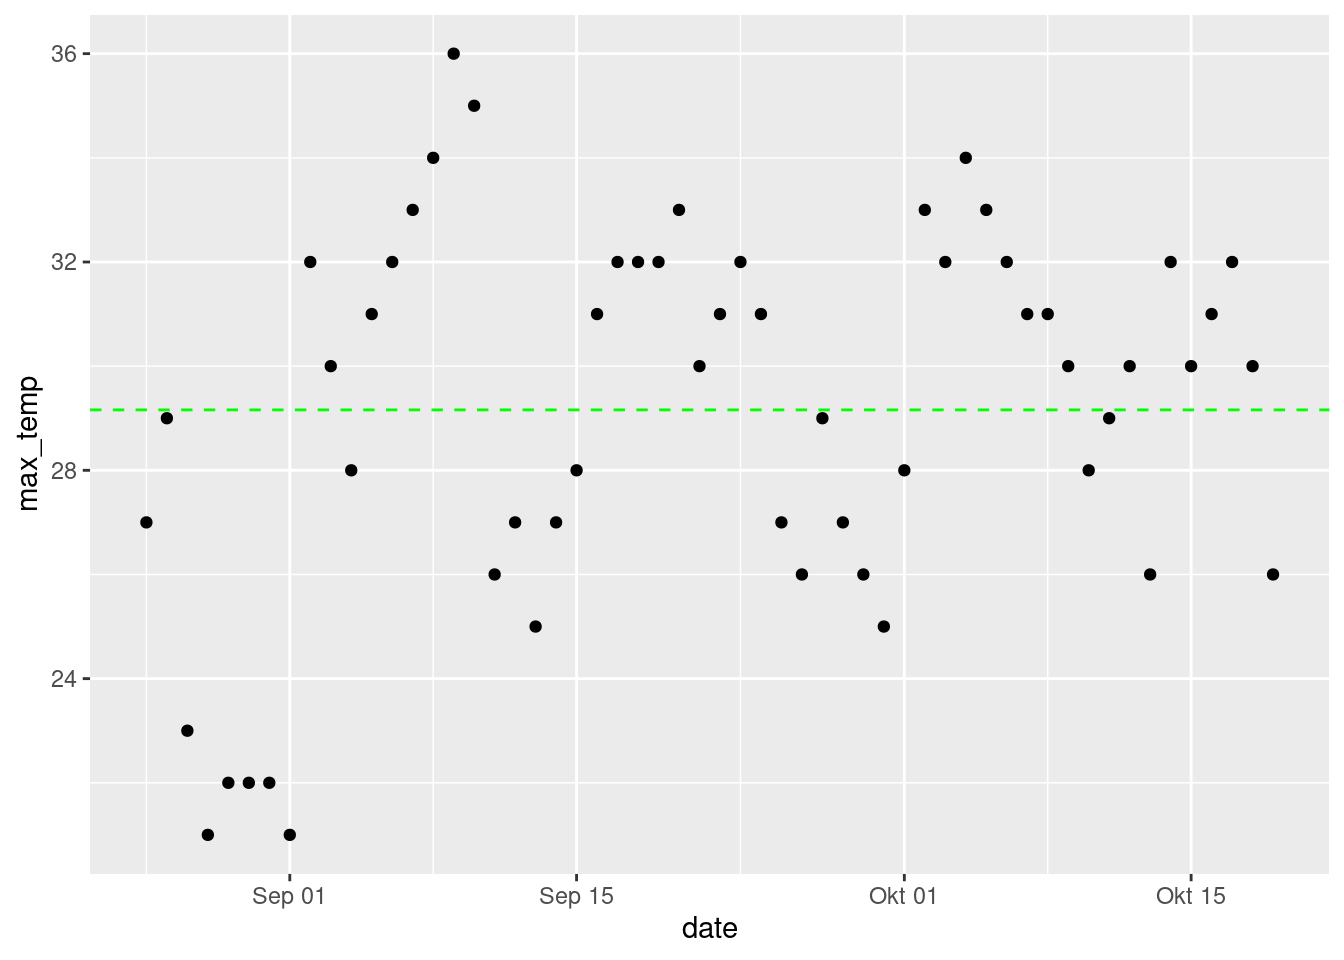
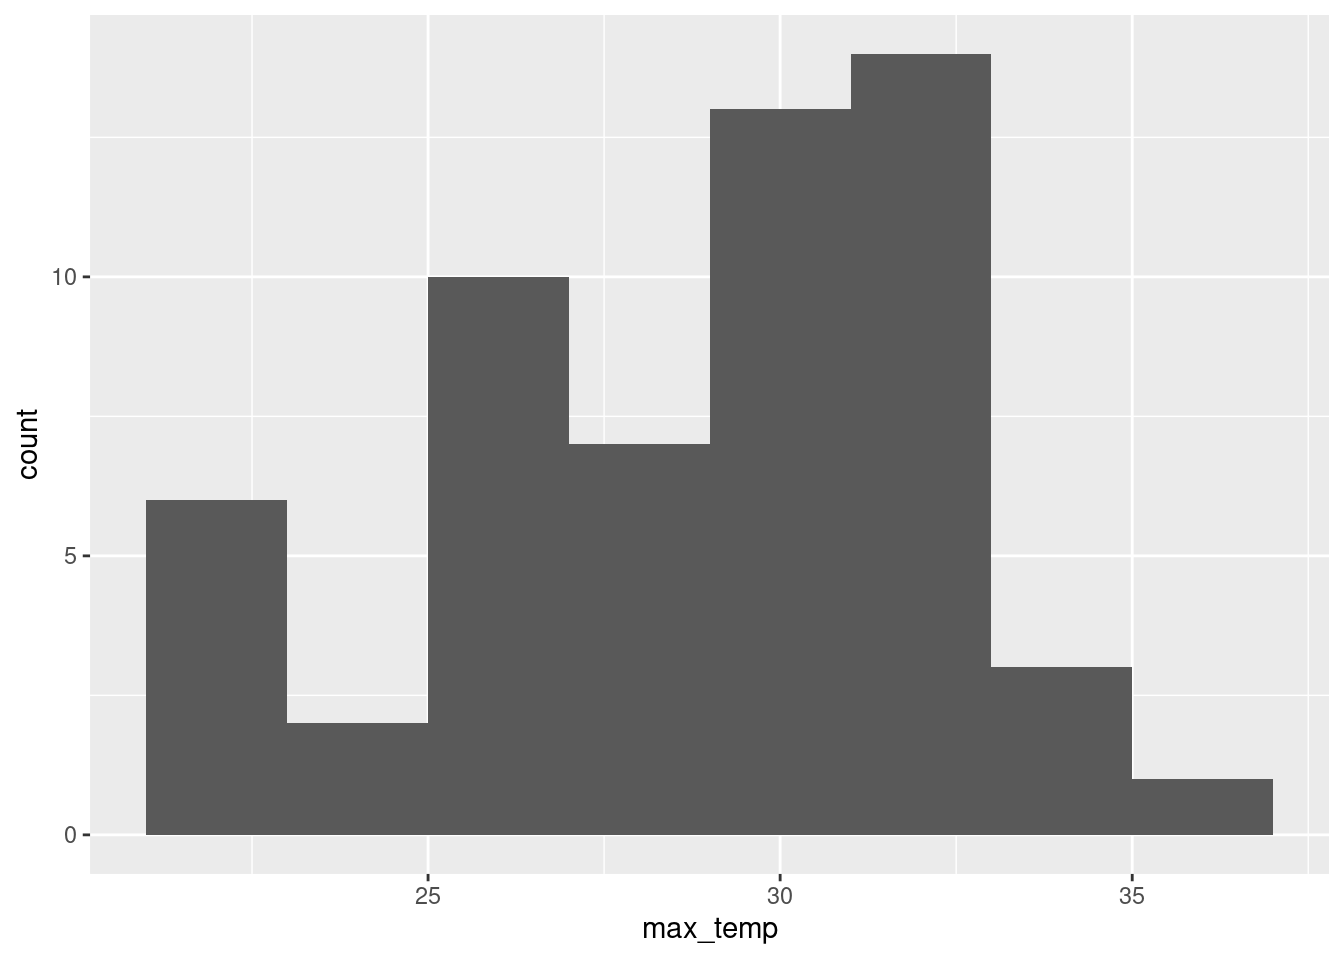
This time I think the distribution is fairly symmetric. The mean max. temperature is 29.16 °C.
Daily Amount of Pictures/Videos Taken
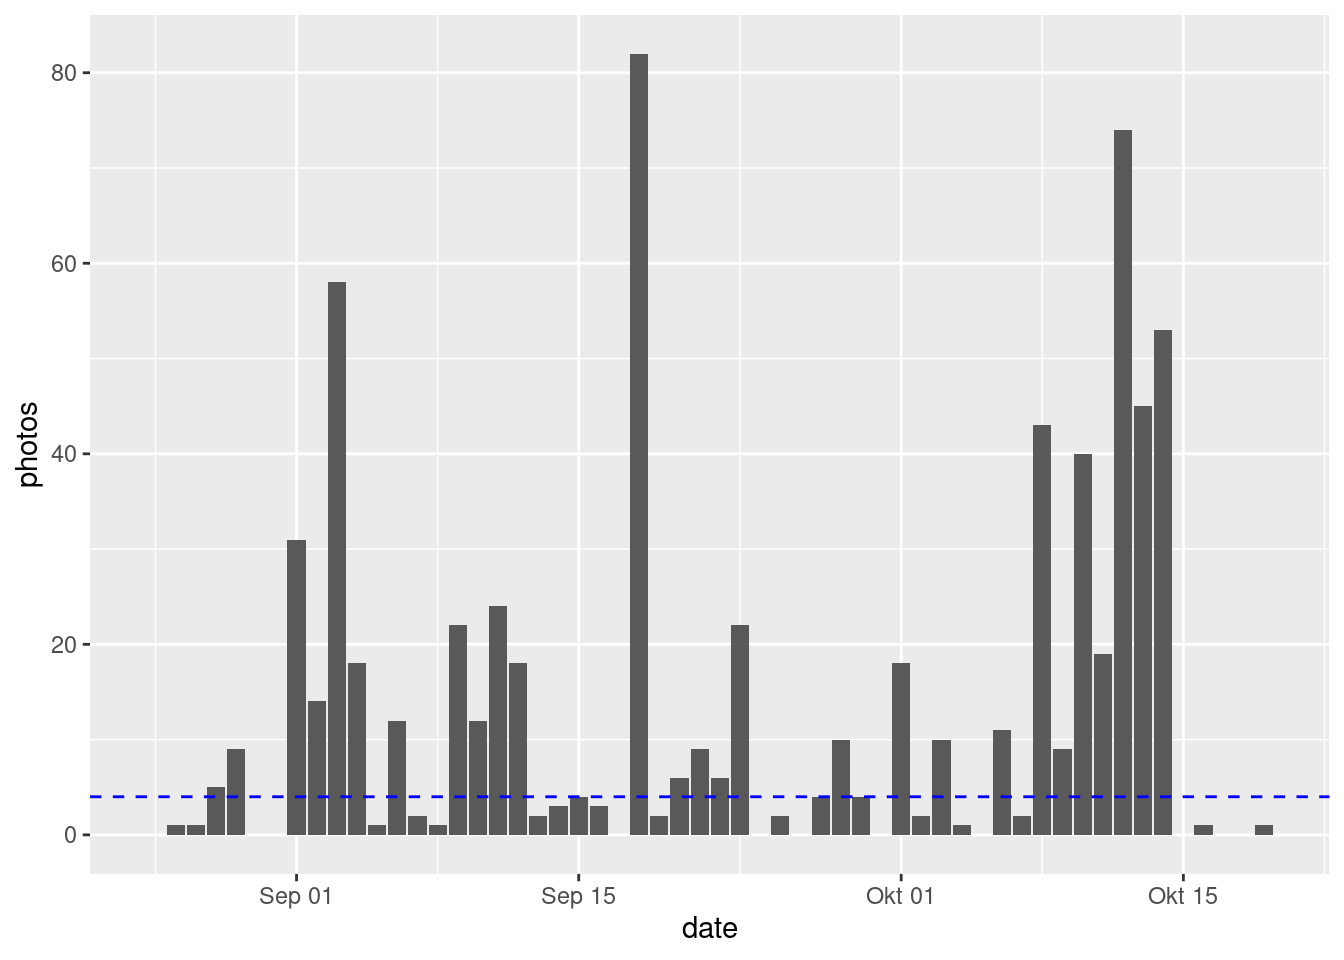
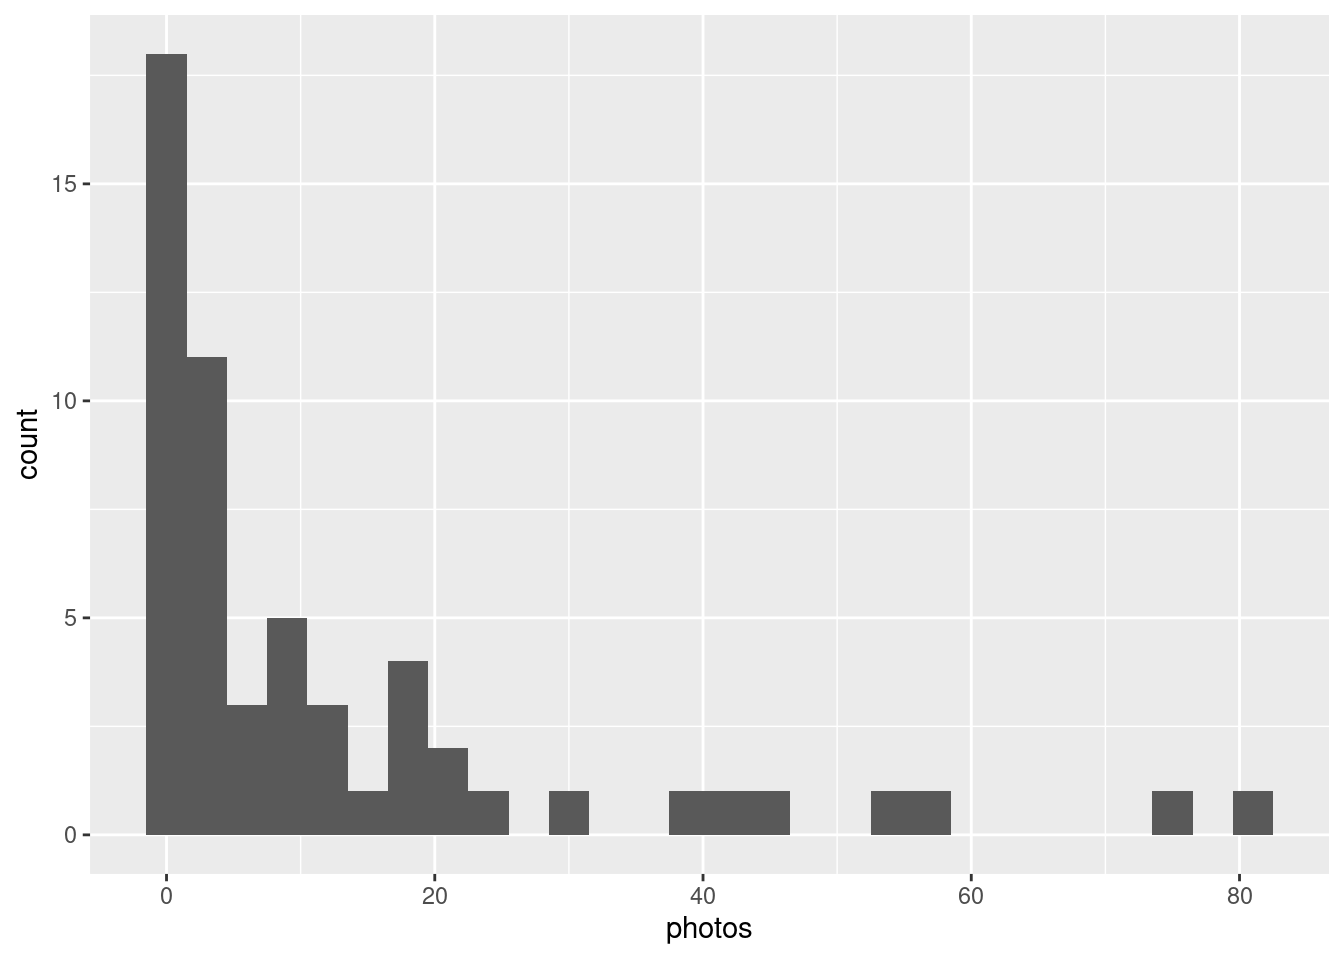
Correlations
Now I think the most interesting part is seeing if there are any correlations:
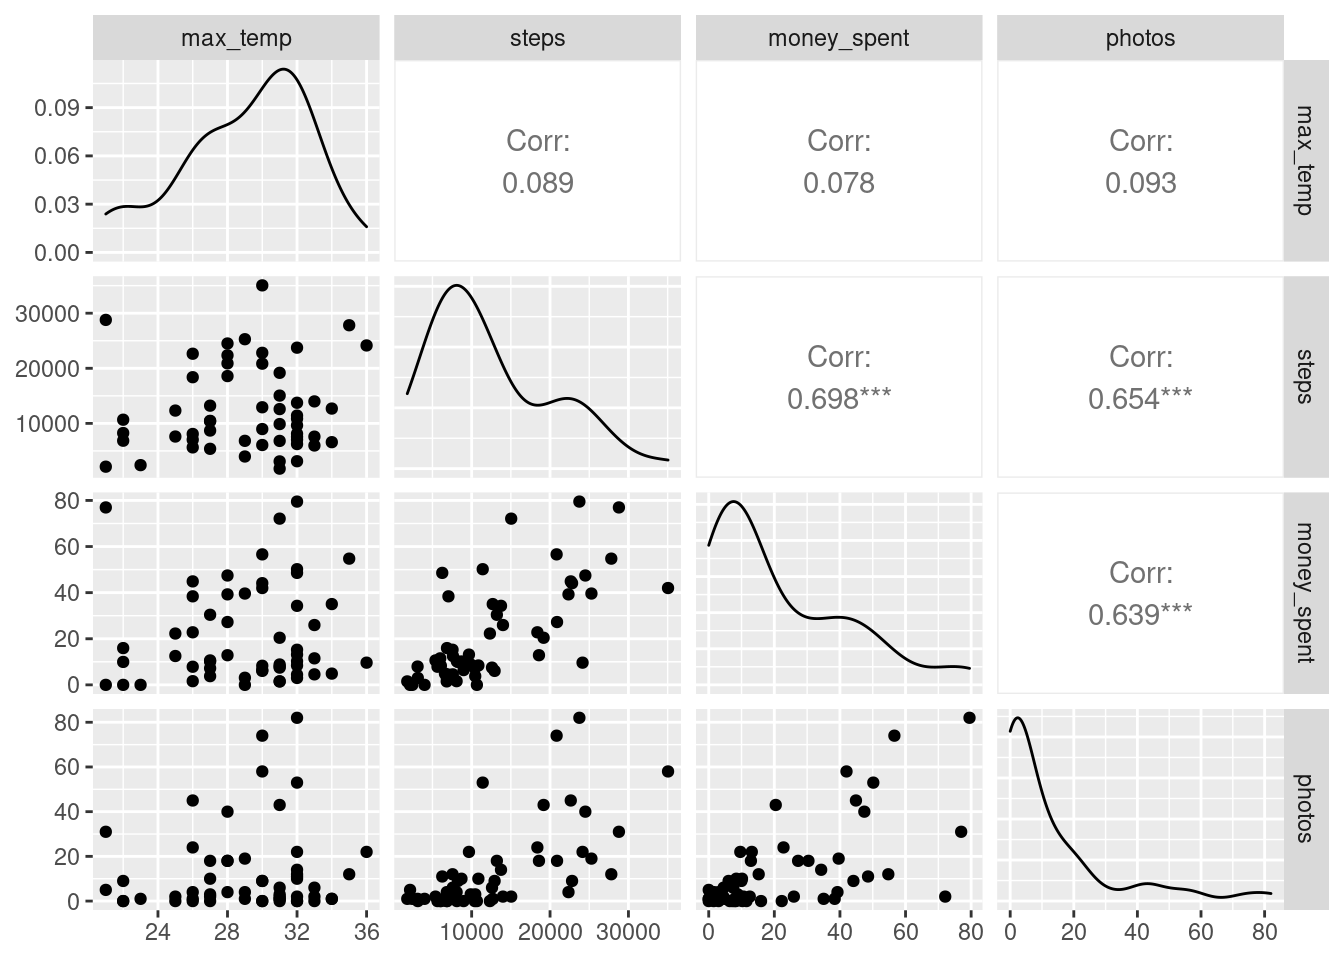
And there really seems to be correlations between:
money spent - steps
money spent - photos
steps - photos
For example the correlation between money spent and steps seems to be 0.698.
Nice.
Which means on days I walk more I usually spend more money and take more pictures. Makes sense.
The max. temperature hasn’t seen that much variation yet, so maybe with more time some correlation will be visible with that too.
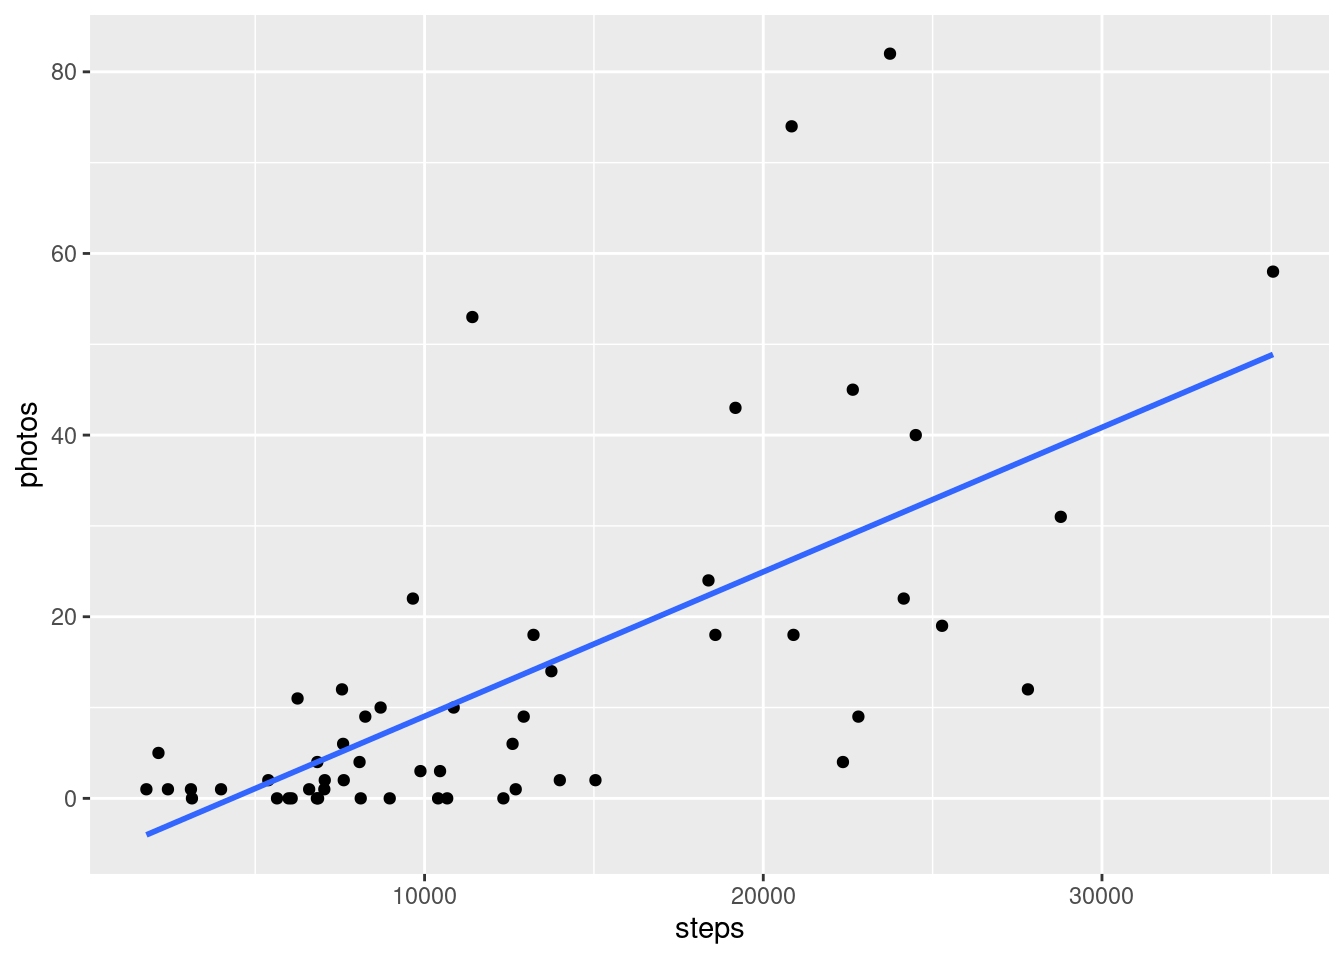
If we zoom in on the plot of steps and photos for example we can also see a correlation just by eyeballing:
And that's it for now. With more time and data I think it should be more interesting, so the next time I will do this probably in a few months.